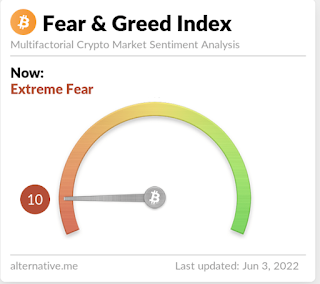
Quickly asses market sentiment for crypto - Crypto Fear & Greed Index and Bitcoin Volality Index

With so much hype of bull markets (greed) and bear markets (fear), it can be very helpful to understand the context of crypto markets with an indicator.  For example, with Bitcoin at $29,700 is it a bull market or bear market?  If it was January 2021, with it being an all time high, you would say bull market.  But if it is June 2022, where it has been constantly going down from a high of $63,000 you would say it is a bear market.  Below are 2 types of indicators that can help provide more context.

1. Crypto Fear & Greed Index

The Crypto Fear & Greed Index tries to quantify current emotional sentiment of Bitcoin and Crypto markets into a number between 0 and 100.  With 0 being Extreme Fear and 100 represents Extreme Greed.  Currently, we are near extreme fear.  In the above example with Bitcoin at $29,700 it was 88 in January 2021 and currently in June 2022 it is 10.

The index is composed of multiple factors (25% Volatility, 25% Market Momentum/Volume, 15% Social Media, 15% Surveys, 10% Dominance, 10% Google Trends).  More info can be found here:

https://alternative.me/crypto/fear-and-greed-index/

2. Implied Volatility Indexes

BVIN Index

This index is created similar to the CBOE VIX using a Variance calculation for 30 day options, but uses Deribit as it's options source.

BitVol Index
This index is created similar to the CBOE VIX using a Variance calculation for 30 day options, but looks to use LedgerX as it's options source. 

Applying the same calculations we did with VIX, for Bitcoin with a Volatility of 73%, we can use that to infer the below expected moves.

Bitcoin Expected Move


days1std (68%)2std (95%)3std (99.7%)
13.8%7.6%11.5%
3020.1%40.1%60.2%

Takeaways

By taking a quick glance at the Crypto Fear & Greed index you can get an idea of the emotional sentiment around Bitcoin and other crypto currencies.  Further by looking at the volatility indexes you can get an idea of how much the market expects crypto to move going forward.  In summary, the Crypto Fear & Greed Index provides 1 number that takes into account all past information and the Volatility Indexes take into account market expectations giving you a full picture of the crypto market with just 2 numbers.


Related Posts - 

https://www.unpackinvesting.com/2022/05/how-can-you-use-cboe-volatility-index.html


Comments

Popular posts from this blog

using options to recover from a big move against me when buy a stock for shareholder benefits - RCL attempt to repair position

Shareholder Benefits Owning shares of a company can entitle you to special benefits when consuming products or services.  For example, Royal Caribbean Cruises (RCL) provides $100 onboard credit per Stateroom on Sailings of 6-13 nights.  With an upcoming cruise booked and most of my portfolio in cash, I decided to take advantage of this offer.  I've done a few cruises in the past and definitely enjoyed Royal Caribbean, especially having young children; and can imagine I will take more cruises with them in the future. The Purchase of Shares I didn't do any deep Fundamental or Technical Analysis, but looked at a 5 year chart seeing the stock priced at $135 before the COVID-19 pandemic, and during the pandemic reached a low of around $24.  When I purchased the shares it was $40 and dropped in price for the 2 preceding days.  Since I bought at the end of the day, I figured I would sell a call option (overwrite) the next day as the volatility was high around 85%....

How does theta change through time when selling strangles? SPY, META, IEF

What is Theta? Theta is amount of value that an option position changes each day due to the passage of time.   For example, SPY closing at 411.99 and Implied Volatility (IVOL) 22.58% SPY 9/16/22 (47 DTE) Strike delta price theta 376P -0.15 3.12 -0.09 440C 0.15 1.97 -0.07 The above table shows that the 376 Put has a theta of -0.09.  This means the option will lose $9 a day (each contract represents 100 shares so -0.09 x 100 = -$9. To standardize, the theta/price is a ratio that can be used.  In our example  -$9/411.99 => -0.02%. Table of Theta for 15 delta Strangles for SPY, META, and IEF Information was pulled from market data on 7/31/2022 taking the initial strikes and seeing how the data changes for different upcoming Days to Expiration (DTE).  (15 delta Strangles for SPY correspond to 376P and 440C). SPY is the most active ETF for S&P 500. IEF is an ETF of 10 year Bonds. META is the ticker for the company formerly known as Facebook. Analysis 1) T...

Trading Ethereum (ETH) merge? Are the CME Ethereum Options on Micro Futures markets reasonable?

Ethereum Merge Brief Background Most people are aware of Proof-of-Work (consensus mechanism to validate blocks on the blockchain - this is done with miners solving math problems (work)).  Ethereum, the second largest Crypto Currency is moving from a Proof-of-Work to Proof-of-Stake (consensus mechanism that validates blocks through a validator (like voting) system).   The main reason for doing this is to get away from miners wasting electricity solving useless math problems to a system that doesn't waste energy on miners.   One argument against moving to Proof-of-Stake, is that it becomes more about controlling a large number of validator nodes (so in a sense, the larger validators have more say, whereas Proof-Of-Work rewards are more 'fair' as it is randomly distributed. Either way you look at it being positive or negative, it is an event that can be traded as the current estimated merge date (the date the blockchain switches from Proof-of-Work to Proof-of-Stake...